Summary: Latitude vs. X

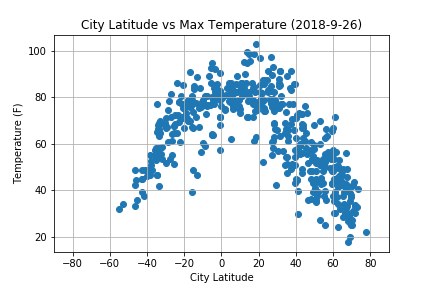
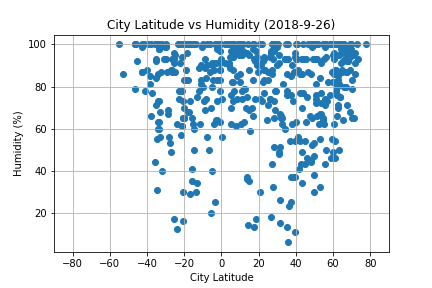
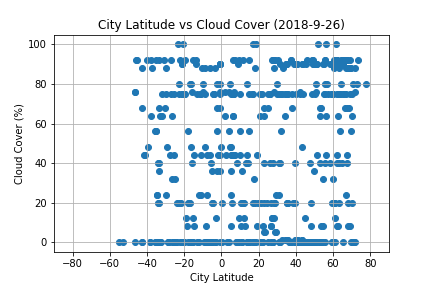
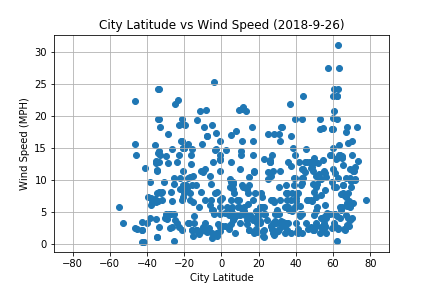
The purpose of this project was to investigate how weather varies with distance from the equator. In order to perform this analysis, data was pulled for 504 randomly distributed cities using the OpenWeatherMap API on September 26th, 2018.
The data gathered from OpenWeatherMap was plotted using Matplotlib in order to visualize the effects of latitude on the following variables:
In addition to the visulations, this site contains the original dataset and analysis of trends observed.
For the original project repository, please follow this link.
Visualizations